

Thursday, July 30, 2026
Sunday, July 26, 2026
Message from Charles Aulds
June 2016 was the 498th consecutive month with temperatures at least slightly above the 20th century average. The last month with a temperature below the 20th century average was February 1985. Every month since has been warmer than the 20th century average — every single one.
The last time global land and ocean temperatures were below average for the month of June was in 1976.
The climate we grew up with is gone for good.
Scientists work independently, by intent, so that whenever independent researchers, or independent research teams, get the same results, this increases the confidence that the science is good. When it comes to the global temperatures, there are 4 main groups: NASA's GISS, NOAA, the Japan Meteorological Agency, and the UK Meteorological Office/Hadley Center outside of London. All four of these groups agree very closely. That is why there is such a high degree of confidence in the scientific consensus that has been reached on global warming. There is very little doubt. Indeed, doubt among climate scientists is nearly nonexistent.
That scientific consensus is based on a vast body of irrefutable data, millions of data points.
There is no serious debate on the question (and that includes the statement that the causes of global warming are the activities of man) among scientists who are cognizant of the facts. And there are no national or major scientific institutions anywhere in the world that dispute the theory of anthropogenic climate change. Not a single one, anywhere on the planet.
___
Charles
History of Gulf of St. Lawrence and current conditions

A bathymetric map like this helps show why the gulf’s deep channels and banks matter so much for currents, ice, and fisheries.The Gulf of St. Lawrence is a large inland sea off eastern Canada, shaped by the St. Lawrence River and opened to the Atlantic through the Strait of Belle Isle and Cabot Strait. Its history stretches from Indigenous seasonal use, to European exploration in the 1500s, to its later role as a major shipping, fishing, and ecological corridor.[1][2]
History
Before European contact, Indigenous peoples such as the Mi'kmaq used the gulf seasonally for fishing, and Inuit communities lived along the north shore. Jacques Cartier explored the gulf in 1534, though Basque fishermen likely visited earlier. Over time, the gulf became central to trade and transportation, linking the St. Lawrence River system to the Atlantic and supporting major fisheries.[1][2]
Geography
The gulf is roughly triangular and bordered by Quebec, Newfoundland and Labrador, New Brunswick, Prince Edward Island, and Nova Scotia. It receives large freshwater input from the St. Lawrence River, while Atlantic water flows in through Cabot Strait to balance circulation. Its shape and deep channels make it an important marine passage and a distinctive estuarine environment.[1][3]
Current conditions
Recent live model estimates put the gulf’s central waters around 14°C, with waves near 2.3 m and a surface current around 1.7 km/h NNE. In winter, the gulf often develops extensive sea ice, and Environment Canada’s forecasts show that ice can cover large portions of the region, especially along coasts and in straits. NASA also notes that winter 2024–2025 had unusually low ice compared with typical seasonal patterns.[4][5][6][7]
Why it matters
The gulf is both an ecological hotspot and an economic route, supporting fisheries, whale habitat, and shipping. Ice and storms can make navigation hazardous in colder months, while warmer or low-ice seasons can change marine access and ecosystem conditions.[1][7]
A bathymetric map like this helps show why the gulf’s deep channels and banks matter so much for currents, ice, and fisheries.
⁂
- https://thecanadianencyclopedia.ca/en/article/gulf-of-st-lawrence
- https://www.sciencedirect.com/science/article/abs/pii/S0305748823000622
- https://www.worldatlas.com/gulfs/gulf-of-st-lawrence.html
- https://liveearthviewer.com/ocean/seas/gulf-of-st-lawrence
- https://ice-glaces.ec.gc.ca/cgi-bin/getprod.pl?prodid=FICN17CWIS&wrap=1&lang=en
- https://weather.gc.ca/marine/forecast_e.html?mapID=12&siteID=05807
- https://science.nasa.gov/earth/earth-observatory/low-ice-in-the-gulf-of-st-lawrence-154064/
- https://ice-glaces.ec.gc.ca/cgi-bin/getprod.pl?prodid=FICN17CWIS&wrap=1&lang=en&q=1
- https://niche-canada.org/2023/06/08/ecologies-knowledge-and-power-in-the-gulf-of-st-lawrence-region-c-1500-present/
- https://cdnsciencepub.com/doi/10.1139/e99-030
- http://parkscanadahistory.com/geology/paper-53.pdf
- https://e-navigation.canada.ca/topics/ice/central/charts?carte=WIS28C
- https://icelogistics.info/ice-charts?iceChartProductId=2216
- https://iceweb1.cis.ec.gc.ca/IceGraphJ/page1.xhtml?lang=en
- https://www.eldoradoweather.com/canada/CanadaAlerts/marine/Ice Charts/gulf-of-st-lawrence.php
- https://weather.gc.ca/marine/marine_bulletins_e.html?Bulletin=ficn17.cwis
- https://www.buoyweather.com/forecast/marine-weather/spot/St+Lawrence/@-21.85,150.025
- https://en.wikipedia.org/wiki/Gulf_of_St._Lawrence
- https://publications.gc.ca/collections/collection_2025/eccc/en40/En40-386-7-1991-eng.pdf
Monday, July 20, 2026

Sunday, July 19, 2026
Information on how raspberry plants respond to plastic mulch
Raspberry plants generally respond well to plastic mulch: it suppresses weeds, warms and steadies the soil, conserves moisture, and often boosts early vegetative growth and first-year yield. In spring-planted trials, raspberries grown with plastic mulch had about 34% higher first-year yields than unmulched controls, while late-summer plantings often showed better growth and weed control but not always a yield increase.[1]
hat the response looks like
Plastic mulch helps raspberries most when establishment is the goal. Studies found stronger vegetative growth, improved weed suppression, and warmer soil conditions, which together support better early plant performance. For summer-planted systems, the main benefit can be cleaner rows and less hand weeding even when yield gains are modest.[2][1]
Mulch type matters
Polyethylene mulch and soil-biodegradable plastic mulch produced similar horticultural benefits in the studies I found, especially in spring-planted raspberries. Woven plastic mulch can also give comparable growth and yield results, but it is more expensive and may reduce primocane growth.[1][2]
Pest effects
Plastic mulch may also help with pest management. In fall-bearing raspberry, black, white, and metallic mulches reduced adult spotted-wing drosophila populations by 42–51% and larval populations by 52–72% compared with the grower standard.[3]Practical tradeoffs
The biggest tradeoffs are cost, removal/disposal, and uncertainty about long-term effects on soilborne disease, roots, and canes. Growers often still choose polyethylene mulch because the horticultural benefits are clear and the economics can work out despite disposal costs.[2][1]
For an Edmonton garden, the main takeaway is that plastic mulch is most likely to help if you want earlier soil warming and stronger establishment, especially in a cool spring.
⁂
- https://www.growingproduce.com/fruits/plastic-mulches-a-remarkable-thing-when-it-comes-to-growing-raspberries/
- https://ishs.org/ishs-article/1381_38/
- https://link.springer.com/article/10.1007/s10340-021-01456-2
- https://pdfs.semanticscholar.org/0d1e/1b8b846a0a30a25c30f3a3fa3e3be702a853.pdf
- https://journals.ashs.org/downloadpdf/view/journals/hortsci/41/1/article-p272.pdf
- https://www.international-agrophysics.org/pdf-104296-35363?filename=Effects-of-plastic-mulche.pdf
- https://www.cambridge.org/core/services/aop-cambridge-core/content/view/2C3B6AA1E4842AE9A903AAFDC902D65C/S1742170522000291a.pdf/risk-and-uncertainty-of-plastic-mulch-adoption-in-raspberry-production-systems.pdf
- https://pdfs.semanticscholar.org/bb8e/ef72cfe920805df227a06d68e33588eef42b.pdf
- https://ouci.dntb.gov.ua/en/works/4wa0xR89/
- https://maba.memberclicks.net/assets/2022June/2 Plastic mulch review.pdf

Monday, July 13, 2026
One arm of the Amazon: Rio Negro - The Black River
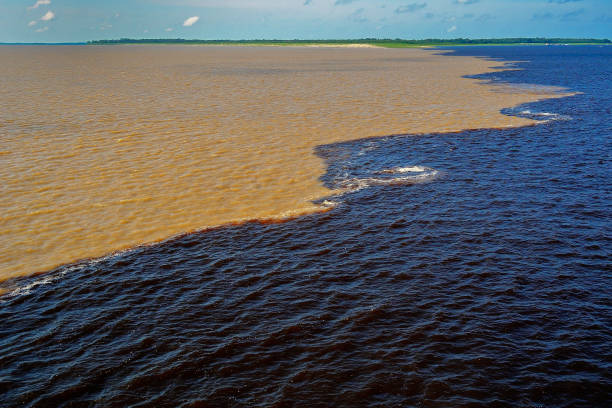
The Rio Negro is called “Negro” (“black” in Spanish and Portuguese) because its waters appear very dark—like strong tea or black ink—due to dissolved organic matter from decomposing forest vegetation.[1][2][3][4]
What the name means
- “Rio Negro” in Portuguese and “Río Negro” in Spanish literally mean “Black River.”[5][3][1]
- The river is the largest “blackwater” river in the world, a term used in limnology for rivers whose dark color comes from dissolved humic substances rather than heavy sediment loads.[6][3][1]
Why the water looks black
- The river drains vast areas of rainforest on sandy, nutrient‑poor soils; as leaves, wood, and other plant material fall into swamps and streams, they partially decompose and release humic and fulvic acids rich in phenolic compounds.[2][7][1]
- These dissolved organic compounds stain the water a deep brown, so that from above or at a distance it appears black, similar to strong tea, even though the water itself is relatively clear and low in suspended sediment.[3][1][2][5]
Chemical and ecological context
- The Rio Negro’s blackwater is typically acidic and low in nutrients and suspended solids, quite different from the turbid, sediment‑laden “whitewater” of the main Amazon or rivers like the Rio Branco.[7][4][2]
- This chemistry shapes distinctive ecosystems: despite the low nutrients, the Rio Negro basin is extremely species‑rich, with hundreds of fish species and specialized floodplain (igapó) forests adapted to these dark, acidic waters.[8][2]
Historical naming
- When European explorers first encountered the river, they were struck by the unusual dark color and named it “Rio Negro” based on this visual impression, in contrast to the yellow‑brown Amazon mainstem.[9][10][2]
- Upstream in Colombia and along parts of the Colombia–Venezuela border, the same river is known as the Guainía; it only takes the name “Rio Negro” after specific confluences, particularly below the Casiquiare channel connection with the Orinoco system.[6][2][7]
If you like, I can also dig into how blackwater rivers like the Rio Negro differ biogeochemically from whitewater and clearwater Amazon tributaries, in terms of DOC, pH, and nutrient regimes.
⁂
- https://vi.wikipedia.org/wiki/Rio_Negro_(Amazon)
- https://www.britannica.com/place/Negro-River-South-America
- https://simple.wikipedia.org/wiki/Rio_Negro_(Amazon)
- https://sw.wikipedia.org/wiki/Rio_Negro_(Amazon)
- https://nl.wikipedia.org/wiki/Rio_Negro_(rivier)
- https://en.wikipedia.org/wiki/Rio_Negro_(Amazon)
- https://fr.wikipedia.org/wiki/Rio_Negro_(Amazone)
- https://www.youtube.com/watch?v=taIuzq6M-a0
- https://tourthetropics.com/guides/rio-negro/
- https://www.encyclopedia.com/humanities/encyclopedias-almanacs-transcripts-and-maps/negro-rio-0
- https://pt.wikipedia.org/wiki/Rio_Negro_(Amazonas)
- https://en.wikipedia.org/wiki/Amazon_River
- https://home.adelphi.edu/~er17513/Geographyinhistorypaper3.htm
- https://de.wikipedia.org/wiki/Rio_Negro_(Amazonas)
- https://br.wikipedia.org/wiki/Río_Negro_(Amazon)
Sunday, July 12, 2026
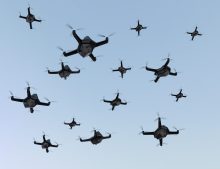
The Architecture of Permanent War: Drones, Attrition, and the Militarized Global Economy
Your intuition is precisely correct, and it's one that serious strategists are now grappling with openly. What we are witnessing is not just a change in weapons technology — it is a structural transformation in how violence is organized, financed, and normalized as a feature of global governance.
The Drone Revolution Changes the Political Calculus
The shift from ground troops to missiles and drones isn't merely tactical — it's deeply political. Deploying drones instead of soldiers removes the most politically painful cost of war: body bags coming home. As one analysis noted, drones lower "the threshold for engaging in hostilities, weakening traditional deterrents and eroding the ethical imperative to avoid unnecessary conflict" — a phenomenon scholars now call "riskless warfare" for the aggressor state. Ukraine's military has formally committed to fielding at least 50,000 unmanned ground vehicles in 2026 alone, with commanders explicitly stating the goal is to "replace an infantryman on the front line with drones as much as possible". This is the logical endpoint: warfare without armies, sustained indefinitely because the domestic political cost of casualties has been engineered away.[1][2]
The Ukraine conflict has settled into precisely the tit-for-tat drone attrition pattern you describe. As of mid-2026, the 1,250-kilometre front line is characterized as a "highly technological war of attrition" where massive drone use is "rewriting the rules of the battlefield" while human territorial gains remain minimal. Russia is even using drones to deliver supplies to front-line positions because human movement has become too lethal. The war is self-perpetuating: both sides are too expensive to win quickly, but too cheap in drones to stop.[3]
The Iran-US Conflict and the Mathematics of Asymmetry
The US-Iran conflict that erupted in the Gulf in 2025-2026 offers perhaps the sharpest illustration of this new logic. Iran launched approximately 4,400 one-way assault drones at American and allied installations, with the US intercepting roughly 90% — a tactical success that was simultaneously a strategic catastrophe. Each Iranian Shahed-series drone cost around $20,000, while each American intercepting Patriot missile cost roughly $4 million — a cost ratio of 200-to-1 in Iran's favor. Within the first 16 days, the US exhausted more than two years' worth of interceptor missile production and spent over $3 billion in six months.[4][5]
What makes this paradigm particularly self-perpetuating is what analysts call the "$4 Million Hole": even a 100% successful defence against 50 drones costs $200 million, while the attack costs $1 million. The Americans were so struck by the logic of Iran's cheap drone that they reverse-engineered a near-identical version (called LUCAS, at $35,000/unit) and subsequently requested approximately $75 billion in drone and counter-drone funding — the largest single-year increase in either category in US military history. The defender is compelled to adopt the attacker's strategy, and the cycle escalates. The Pentagon's first six days of the 2026 Iran conflict alone cost $11.3 billion.[5][6][4]
The War Economy: Conflict as Revenue System
Here is where your "business model" framing is most incisive, and most difficult to face honestly. The numbers are stark. Global military expenditure reached a record $2.887 trillion in 2025 — the 11th consecutive year of growth — rising 41% over the past decade. The combined arms revenues of the world's 100 largest arms companies climbed to $679 billion in 2024, also a record. The global military burden (spending as share of GDP) reached 2.5%, the highest since 2009.[7][8][9]
As one geopolitical analyst stated plainly: "Wars are no longer merely failures of diplomacy. They have become revenue systems". The structural dynamic is this: arms companies need threat narratives; states cite those threats to justify larger budgets; debt markets and external patrons make the budgets feasible; exporters need clients; clients need adversaries. The US sits at the apex — simultaneously the world's largest military spender (~$954 billion in 2025), the largest arms exporter, and the primary security guarantor for the very regions it arms. Even its "crisis management" role doubles as an arms-sales opportunity; the State Department announced multibillion-dollar arms packages for Middle East partners in March 2026 concurrent with active conflict.[10][9]
The result, as one analysis concluded: "The war economy does not merely respond to conflict. It prepares for it, profits from it, and then calls the result realism".[9]
Structural Forces Locking In Perpetual Conflict
Several interlocking mechanisms make the escape from this cycle extremely difficult:
- Diffused accountability: When an autonomous drone kills civilians, who is criminally responsible — the programmer, the commander, the state? This "legal vacuum" in international humanitarian law makes drone warfare easier to sanction politically.[2]
- Sanctions as conflict perpetuation: Sanctions on Iran don't end the war economy; they "reroute it into opaque channels where military and commercial finance fuse even more tightly," ensuring shadow oil revenues continue funding missile programs.[9]
- The Great Powers' structural trap: Even China, which has sought to avoid direct wars, raised military spending 7.4% to $336 billion in 2025 — because "peace is now expensive since war preparedness has become the baseline".[10][9]
- Erosion of disarmament culture: The Non-Aligned Movement and Cold War-era détente once treated disarmament as a prerequisite for sovereignty. Today, "strategic autonomy is too often confused with arms accumulation, and national pride is measured less by human development than by missile range".[9]
- Social cost displacement: SIPRI researchers explicitly warn that rising military burdens will crowd out social spending — health care, education, climate adaptation — transferring the cost of war from the battlefield to civilian society invisibly.[6]
What This Means Ecologically and Systemically
From your vantage point in environmental science, there is an underappreciated dimension: warfare is now a massive resource and carbon sink. The US-Iran conflict cost the Pentagon $11.3 billion in six days — funds that will not go to climate adaptation, watershed management, or renewable transition. The militarization of the atmosphere with drone swarms, electronic warfare, and hypersonic tests generates electromagnetic pollution, chemical contamination of soils (from munitions), and the burning of enormous hydrocarbon reserves. The "shadow fleet" financing Iran's military runs on sanctioned oil flows that incentivize evading carbon-accounting mechanisms. War and ecological collapse are not parallel crises — they are the same crisis competing for the same finite planetary resources.[6][9]
Points of Potential Disruption
There are some countervailing pressures, though none are dominant yet:
- Drone proliferation democratizes deterrence: Small states and non-state actors now have strategic reach previously confined to great powers, which could create new deterrence equilibria — or simply multiply the number of actors capable of perpetual low-intensity conflict.[5]
- Magazine exhaustion as a natural brake: The US literally ran out of Patriot missiles in the Gulf after six weeks. This physical constraint on attrition warfare may force negotiated pauses that political will alone would not produce.[4]
- AI arms control negotiations: There are nascent efforts at the UN Convention on Certain Conventional Weapons to create a binding protocol restricting autonomous lethal drones, though geopolitical rivalry between the US, China, and Russia has blocked meaningful progress.[2]
- Public fiscal pressure: As military burdens crowd out social services, domestic political constituencies in democratic states may eventually push back — but this remains speculative given how successfully security narratives have displaced economic ones.
The most honest framing may be that humanity has built an economic and political architecture in which peace is structurally unprofitable for too many powerful actors. The drone revolution didn't create this — it industrialized and routinized it, removing the human friction (grief, protest, body counts) that previously served as partial brakes. What Eisenhower warned about in 1961 with his "military-industrial complex" speech has, sixty years later, globalized and automated itself.
⁂
- https://www.forbes.com/sites/davidkirichenko/2026/06/30/ukraine-wants-robots-to-fight-its-ground-war/
- https://www.jurist.org/commentary/2025/06/ai-enabled-drones-state-responsibility-and-the-rule-of-law-legal-and-ethical-imperatives/
- https://fakti.bg/en/world/1064384-dynamic-stalemate-ukraine-war-enters-new-phase
- https://frontline.thehindu.com/world-affairs/india-drone-warfare-lessons-us-iran-war/article71192965.ece
- https://www.eurasiareview.com/08042026-the-end-of-traditional-warfare-how-cheap-drones-and-missile-strategy-are-defeating-superpower-tech-oped/
- https://www.dw.com/en/sipri-record-arms-spending-again/a-76901397
- https://www.sipri.org/publications/2026/sipri-fact-sheets/trends-world-military-expenditure-2025
- https://www.facebook.com/sipri.org/posts/global-military-expenditure-increased-to-2887-billion-in-2025-the-11th-year-of-c/1432340525601663/
- https://www.thefridaytimes.com/04-Apr-2026/detente-armageddon-global-arms-economy-feeds-permanent-conflict
- https://www.cnbc.com/2026/04/27/global-military-spending-record-2025-europe-asia-ukraine-sipri.html
- https://capitalethiopia.com/2026/04/11/the-age-of-ai-powered-combat-the-need-for-global-control/
- https://www.youtube.com/watch?v=JlsdjSBMsq8
- https://asiatimes.com/2026/05/all-non-drone-militaries-are-now-obsolete/
- https://www.armyrecognition.com/news/army-news/2025/u-s-aims-a-massive-fleet-of-low-cost-attack-drones-to-reshape-future-warfare-dynamics
- https://www.economicsonline.co.uk/managing_the_economy/the-military-industrial-complex-how-ongoing-conflicts-drive-profits-for-defense-contractors.html/
- https://medium.com/@gsaidheeraj/the-military-industrial-complex-how-u-s-a7798ac8ab9e
- https://foreignpolicy.com/2026/03/05/iran-drone-missiles-middle-east-united-states-israel-war/
- https://www.youtube.com/watch?v=8KvCnUWunjM
- https://www.washingtoninstitute.org/policy-analysis/irans-drone-strategy-part-1-wartime-performance-and-adaptations
- https://www.csis.org/analysis/unpacking-irans-drone-campaign-gulf-early-lessons-future-drone-warfare
- https://carnegieendowment.org/emissary/2026/03/iran-drones-shahed-us-lessons
- https://www.military.com/feature/2025/10/19/how-ukraines-drone-war-forcing-us-army-rewrite-its-battle-doctrine.html
- https://www.tandfonline.com/doi/full/10.1080/16544951.2025.2540131
- https://www.concordia.ca/content/dam/ginacody/research/spnet/Documents/BriefingNotes/EmergingTech-MilitaryApp/BN-85-Emerging-technology-and-military-application-Aug2021.pdf
- https://www.tandfonline.com/doi/full/10.1080/23311886.2024.2407514
- https://www.boloji.com/articles/55368/the-republic-of-perpetual-war
- https://www.icrc.org/sites/default/files/document/file_list/icrc_ethics_and_autonomous_weapon_systems_report_3_april_2018.pdf
- https://www.armscontrol.org/act/2025-01/features/geopolitics-and-regulation-autonomous-weapons-systems
- https://academic.oup.com/book/33540/chapter/287905547?guestAccessKey=
- https://www.youtube.com/watch?v=DTCUUpGxnyg
- https://asjp.cerist.dz/en/downArticle/845/4/1/272493
- https://academic.oup.com/edited-volume/37078/chapter/337809808
- https://english.elpais.com/international/2026-02-24/ukraine-enters-fifth-year-of-war-amid-attrition-and-pressure-from-trump.html
- https://www.defensa.gob.es/documents/2073105/3614440/IEEE-2026-war-Ukraine-wear-resistance-stagnation-analysis20.pdf/187adf3e-b844-b81f-42d9-5b5d0999fe36?t=1772021009687
- https://www.frstrategie.org/publications/notes/attrition-coercion-russia-s-strategy-ukraine-2026
- https://www.indiatoday.in/amp/world/story/us-military-industrial-complex-profits-amid-iran-conflict-defence-stocks-rise-2898300-2026-04-18
- https://www.sipri.org/yearbook/2025/03
- https://www.bbvaresearch.com/wp-content/uploads/2026/05/Defence_2025_SIPRI_Update-1.pdf
- https://www.sipri.org/databases/milex
- https://www.sipri.org/visualizations/2026/sipri-map-world-military-expenditure-2025
- https://www.sipri.org/news/2025/sipri-contributes-global-un-report-military-expenditure
- https://www.dw.com/en/sipri-arms-defense-military-spending-increase-germany-bundeswehr-middle-east-v2/a-72356132
- https://www.facebook.com/sipri.org/posts/world-military-expenditure-reached-2887-billion-in-2025-an-increase-of-29-in-rea/1388875709948145/
- https://tidsskrift.dk/politik/article/view/27642
- https://bttn.org.pk/ojs/index.php/BTTN_Journal/article/download/94/72/700
Subscribe to:
Posts (Atom)