
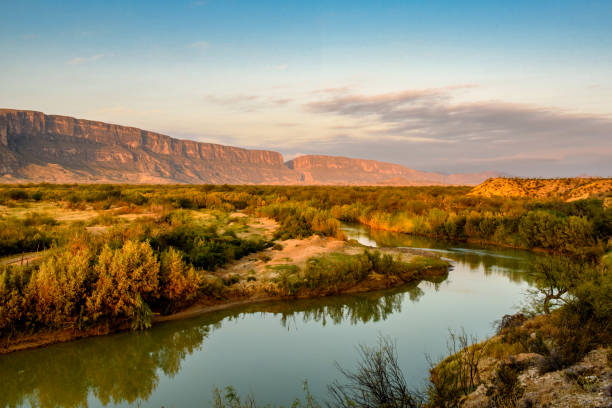
The Rio Grande is currently running at very low to seasonally low flows across most of its U.S. reach, with a few localized exceptions where releases or tributary inflows boost discharge. [1][2][3]
Current flow by key segment
Upper Rio Grande (Colorado → northern New Mexico)
- Gauges in the San Luis Valley and upper basin show very low to near‑zero flows at many sites (e.g., “0 cfs” above US‑380 near San Antonio, NM; single‑digit to low‑double‑digit cfs at several Albuquerque‑area gauges). [2]
- Some mid‑reach gauges below dams (e.g., below Cochiti Dam) are running in the low hundreds of cfs (around 200 cfs), classified as “very low.” [2]
Central New Mexico (Elephant Butte reach)
- The strongest single flow reported on the mainstem is below Elephant Butte Dam, at about 2,080 cfs, flagged as “high” relative to other Rio Grande gauges. [2]
- At Elephant Butte Lake itself, the lake stage is reported around 4,275 ft, with downstream Caballo Lake near 4,134 ft. [1]
- Downstream of these reservoirs, flows drop sharply again (tens to low hundreds of cfs) at many gauges. [2]
El Paso / southern New Mexico – west Texas
- Near El Paso, the river is extremely low: roughly 8.4 cfs with a stage around 1.65 ft and warm water (~87 °F). [1][3]
- This matches the broader pattern of minimal natural flow in the desert reach, heavily dependent on diversions and occasional releases. [2][3]
Lower Rio Grande (Falcon Lake to the Gulf)
- At Falcon Lake, a very large release is showing: about 26,900 cfs with a stage near 263 ft, indicating a major operational pulse or flood‑control release. [4]
- Farther downstream toward the coast, older daily reports (from 2025) show the river at Brownsville with only a few cfs, but those are not “now”; the Falcon Lake pulse suggests significantly higher flows in the lower valley when that release propagates. [5][4]
How “now” these data are
- Most of the real‑time gauge pages (NOAA/USGS via RiverApp, How’s Your River, StreamflowData) are dated within the last few days of late August 2026 and are intended as near‑real‑time. [1][2][4][3][6]
- The International Boundary and Water Commission (IBWC) daily flow table you’ll see on some sites is often updated only on weekdays and may lag by a day or more; treat those as recent but not instantaneous. [5]
Where to check live yourself
For the most up‑to‑the‑minute numbers at a specific location:
- USGS Water Data (National Water Dashboard) – search “Rio Grande” and pick your gauge for current discharge (cfs) and stage.
- NOAA National Water Prediction Service – e.g., “Rio Grande at Laredo” or “Rio Grande at Columbia Bridge” for stage and flood status. [7][8]
- RiverApp / How’s Your River – user‑friendly views of the same USGS/NOAA feeds, with simple graphs and temperature. [1][4][3][6]
- https://www.riverapp.net/en/river/5452aa1ee4b07179033cd0e3
- https://streamflowdata.com/rivers/rio-grande
- https://www.riverapp.net/en/station/5733618a015b58485e8490d3
- https://www.riverapp.net/en/station/57336184015b58485e8490cf
- https://ibwcsftpstg.blob.core.windows.net/wad/DailyReports/flowdata.htm
- https://www.howsyourriver.com/gauges/rio-grande-at-el-paso-tx
- https://water.noaa.gov/gauges/cbbt2
- https://water.noaa.gov/gauges/ldot2
- https://www.argo.net/river-levels-today/
- https://rgisc.org/rio-grande-water-data/


No comments:
Post a Comment